Unit Summary
Statistics is the study of data or information. It involves collecting, recording, organizing, displaying and analyzing these data. Statistics is important because we need accurate information to make correct decisions. The Department of Statistics, Malaysia has a wide range of information. These include finance, trade, manufacturing, services, population and social economic data.
Students play role as research officers from marketing department of an ice-cream company. They will distribute questionnaire to 500 students in the school to collect the data. After collecting the data, they will record the data by using statistics method such as pictogram, bar chart, line graph and pie chart. They also learn how to calculate mode, median and mean using spreadsheet application. Students present their findings to the class or business manager using a multimedia presentation.
Subject Area: Mathematics
Year/Form : Form 3
Student Objectives/Learning Outcomes:
Students will be able to:
1. Determine suitable representation of data
2. Solve problems involving mode, median and mean.
Essential Question
How far does the consumer prefer ice-cream?
Unit Questions
1. How frequent you eat ice-cream?
2. Which ice-cream flavour do you prefer?
Content Questions
Which method is more suitable to present the data?
Why that method is more suitable?
Outcomes should be presentation of data such as (examples):

Line graph

Bar graph

Pie chart
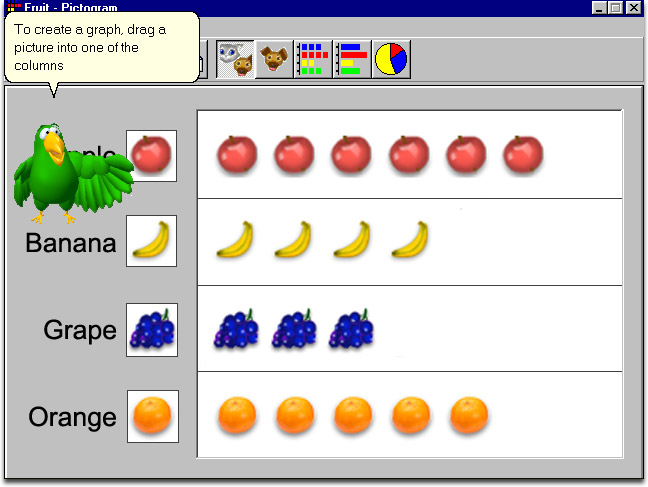
Pictogram
No comments:
Post a Comment